Working with Asset Health Report
Introduction
This guide helps you set up and run a summary report listing tickets, assets count, asset health based on the filtered client accounts in your PSA. All the names are parameters are freely customizable to suit your organization's needs. This system report is located under Reports > System Reports > Service Desk > Asset Health Report.
Prerequisites
- CRM data added to your PSA
- Tickets created for your CRM in your PSA
- Hardware Assets saved in your PSA
Setup
Setup is divided into three parts:
Copy system reports to your folder
- System reports are uneditable, we will have to copy these reports to a custom folder to make it work on your tenant.
- Navigate to Reports > Ad-Hoc Reports
- Create a folder, name it however you like. For this guide, we will name it Asset health.
- Select the report, Choose Duplicate and save in your custom location.
- Navigate to Reports > System Reports > Service Desk > Asset health Report. Copy the reports from the system reports folder to your custom folder created in the previous step.
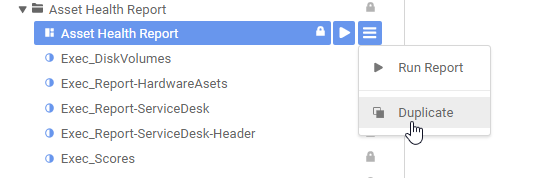
- Select the report, Choose Duplicate and save in your custom location.
- Ensure all the reports are now visible in your custom folder.
Filter your data
Once the mappings are checked, you need to set up filters based on your Client names in CRM.
- Click on the Dashboard, click on the Filter button
- Choose your Client name and a time period for the service desk tiles.
- Select your Client name for your Hardware asset tiles. These filters will now be applied to the dashboard. You can then save and run the dashboard.
- Choose the OS Type and Client name for the Disk volumes filter
- You can also edit the individual tile filters if needed.
- The filters defined here need to have corresponding data in your PSA for the output to be displayed.
| Report | Dashboard tile |
|---|---|
| Exec_DiskVolumes | Server Disk Space |
| Exec_Report-HardwareAsets | Assets Statistics |
| Exec_Report-ServiceDesk | Service Request Statistics |
| Exec_Report-ServiceDesk-Header | Management Summary |
| Exec_Scores | Network Health |
Report: Definition and Customization
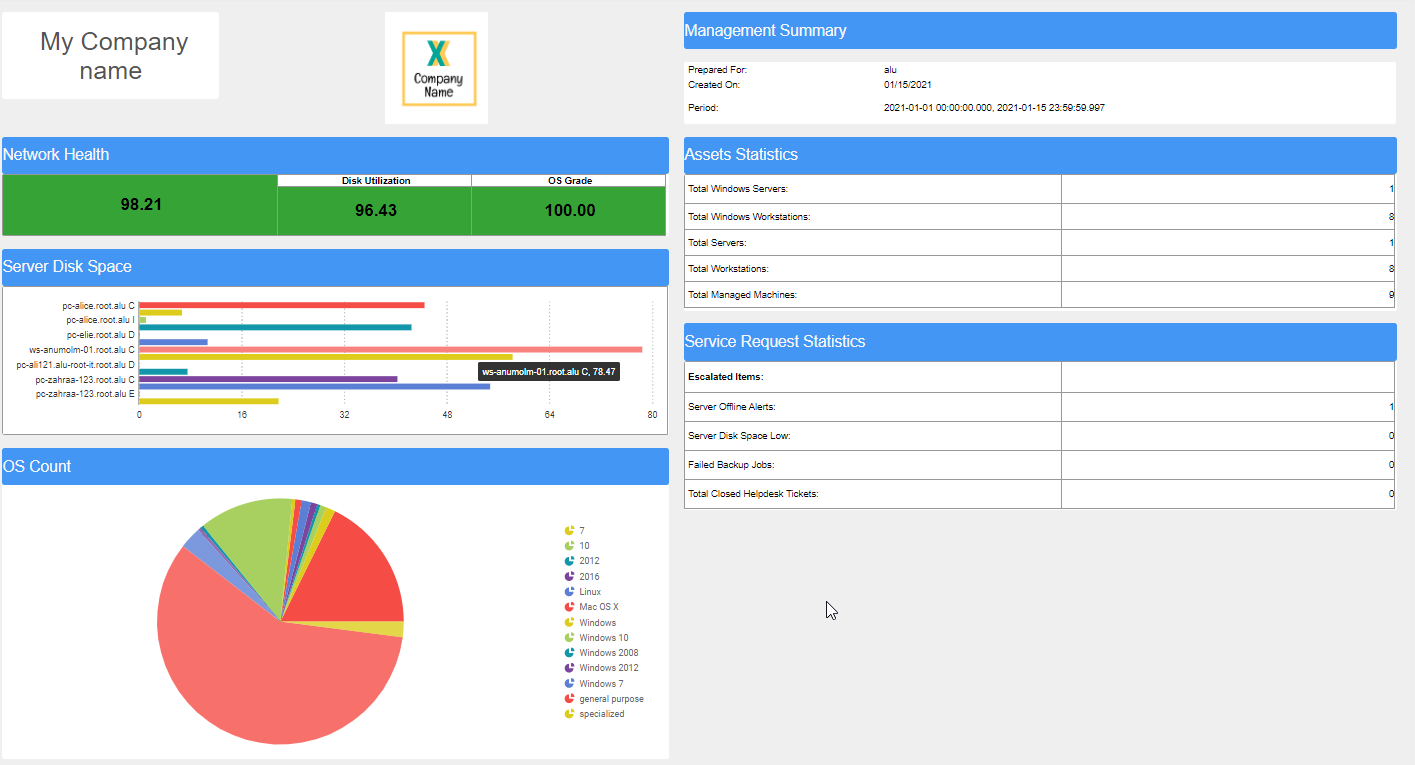
Asset Health Report is the main dashboard report. OS count is an independent widget. Other tiles are derived from Individual reports.
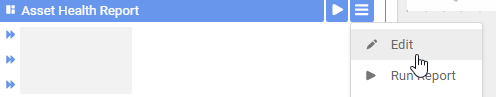
- Open the report in the designer by choosing the option to edit it.
- The Company is set up in a text box to enter your company name, You can add a new tile and add an image to add your company image logo.
- To use your logo, Drag, and drop or browse your desired company logo in the highlighted tile of this dashboard.
- You can drag the tiles around to rearrange the order of data seen in the report.
- OS Count is an independent visualization tile gathering the values from the Ticket Hardware Assets database column.
- All OS Type values defined for assets under Service Desk > Hardware assets will be listed and the value is based on individual unique asset ids from the database.
Below listed individual reports are used to get the data for the Asset Health Report dashboard.
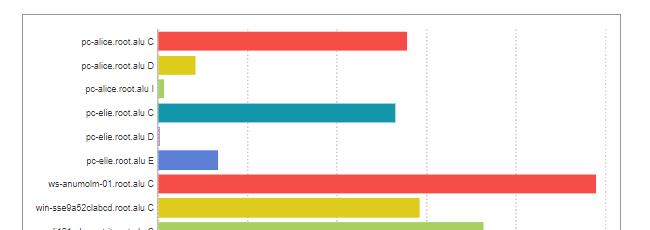
- Exec_DiskVolumes: This chart contains Asset name, Drive, Disk utilization details. The disk utilization will show data per drive. The type of wizard is a Bar chart. The corresponding data for this report in the UI is in Service Desk > Hardware Assets> Asset info > Asset Disk Volumes tab. The tile in the dashboard is named Server Disk Space.
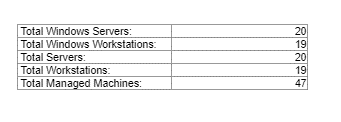
- Exec_Report-HardwareAssets: This report is configured to show the count for different OS types from assets part of your Service Desk > Hardware assets. The tile in the dashboard is named Assets Statistics.
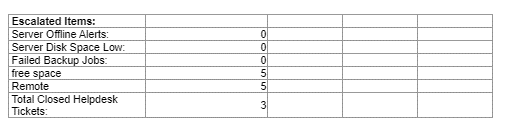
- Exec_Report-ServiceDesk: This report is configured to show the count based on the Ticket titles from your Service Desk > Tickets. The tile in the dashboard is named Service Request Statistics.
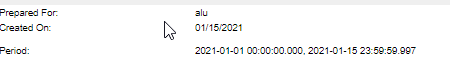
- Exec_Report-ServiceDesk-Header : This report acts as a header to show you the Client name, time period, and created on details. The tile in the dashboard is named Management Summary.
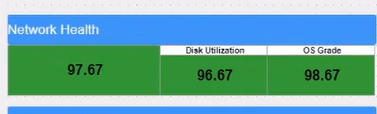
- Exec_Scores: This report gives you a score based on the disk utilization and OS type for the synced assets. The data in the UI will be under Asset Disk Volumes from Service desk Assets. The tile in the dashboard is Network Health.
Working with formulas
The section covers the formulae used and ways to customize them based on your needs.
Exec_Report-ServiceDesk report
You can create additional columns or data parameters in the report based on the ticket tiles and OS types in your PSA. Server offline, disk space, etc. are some examples of ticket titles. If you need to add additional columns, follow the below steps:
- Edit the Exec_Report-ServiceDesk report.
- Insert a column anywhere before the last column. Right-click on the desired column and select Insert Columns.
- Double click or right-click on the empty column to insert a formula. Copy-paste the below formula.
- =If(Contains({Tickets.Title}, "Locked out"), 1,0)
- “Locked out” is the new column that was created. Modify according to your desired results.
- Add a corresponding row before the last row and name it corresponding to your new title.
- Insert =AggSum([X1]) to the ticket tile column, where X corresponds to the newly created column.
Exec_Report-HardwareAssets
You can add more values to the OS types here, they will be categorized under Windows Servers.
- Edit the Exec_Report-HardwareAssets
- Right-click on the column you want to make the change, Edit formula.
- Appended your additional OS types in the formula as below
- If(Contains({Hardware Assets.Os Type},"Myserver typename")
Exec_DiskVolumes
The corresponding data for this report in the UI is in Service Desk > Hardware Assets> Asset info > Asset Disk Volumes tab. This information is only for the RMM VSA integration.
Server Disk Space Scoring
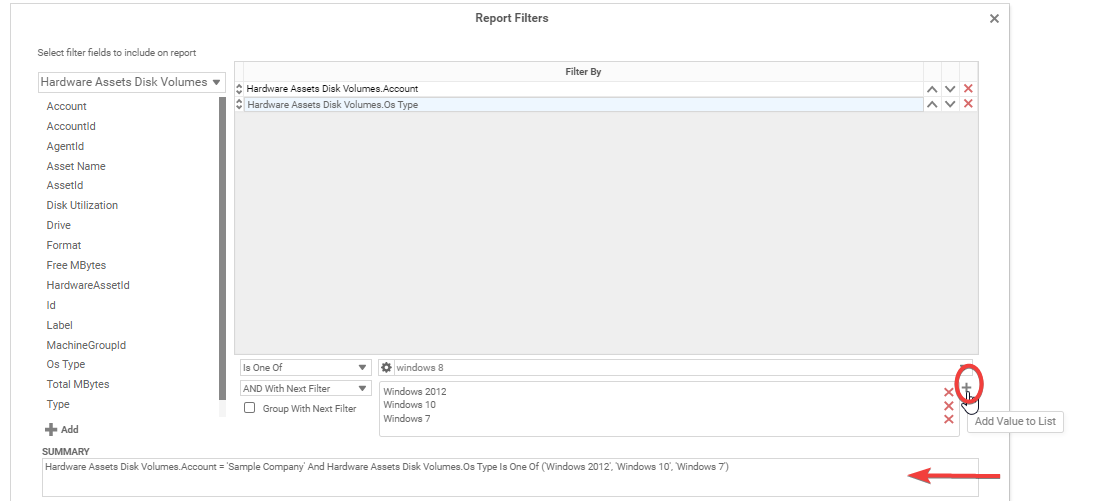
This chart contains Asset name, Drive, Disk utilization details. The disk utilization will show data per drive. The type of wizard is a Bar chart. Filters used on this report are Account and OS Types
- Account - Your CRM Client
- OS Types
- By default the filter is for OS type is for windows 7,10 and 2012. If you need the report to display all OS types you can remove this filter. You can also copy this widget and modify the filter to have OS types like windows 2012 only or macs or windows 7 etc. This will give you data with different widgets for different OS Types.
Disk Utilization Score
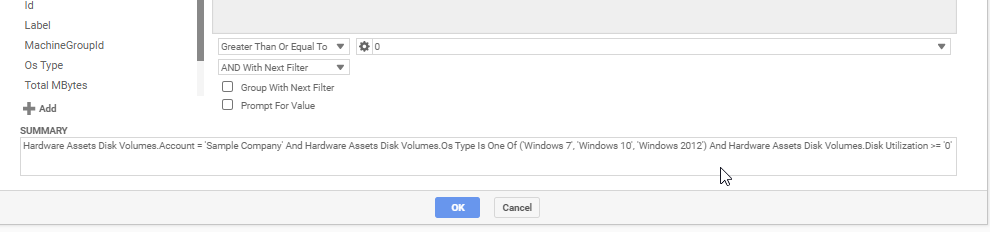
The calculations here are based on this VSA guide. The health score is determined based on the usage percentage. The boundaries with the current formula are 0, 65, 75,85,95. If the disk utilization is greater than 0 and less than 65 the score will be 100 else check the next condition. Between 85 and 95, the score is 25%, Anything higher than 95 will fall to a zero value. The values can be changed to however you would like the number parameters to be defined.
Disk utilization greater than equal to 0 in the formula ensures that the entries with empty disk utilization, which are not storage drives like a cd-rom will not be seen here.
Exec scores
OS Score
The calculations are defined based on the OS types. For example, the Windows 10 OS type can have a score of 100, and XP can have 20. These can be changed to support and match operating system compatibility within your organization. Add OS type to DiskVolumes as shown in the screenshot.
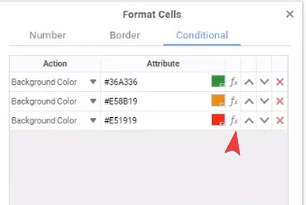
Customizing the Color of the Cell Based on the Output.
The score cell colors are currently formatted with color indicators. The cells have been formatted to use conditional formatting, if you wish to modify the parameters here you can right-click format cell, choose and color and add the formula to it.
- The reports are customizable with renaming labels or choosing OS types. Any tile can be duplicated and data can be customized to the organization's needs.


