Revenue Intelligence Dashboard
Introduction
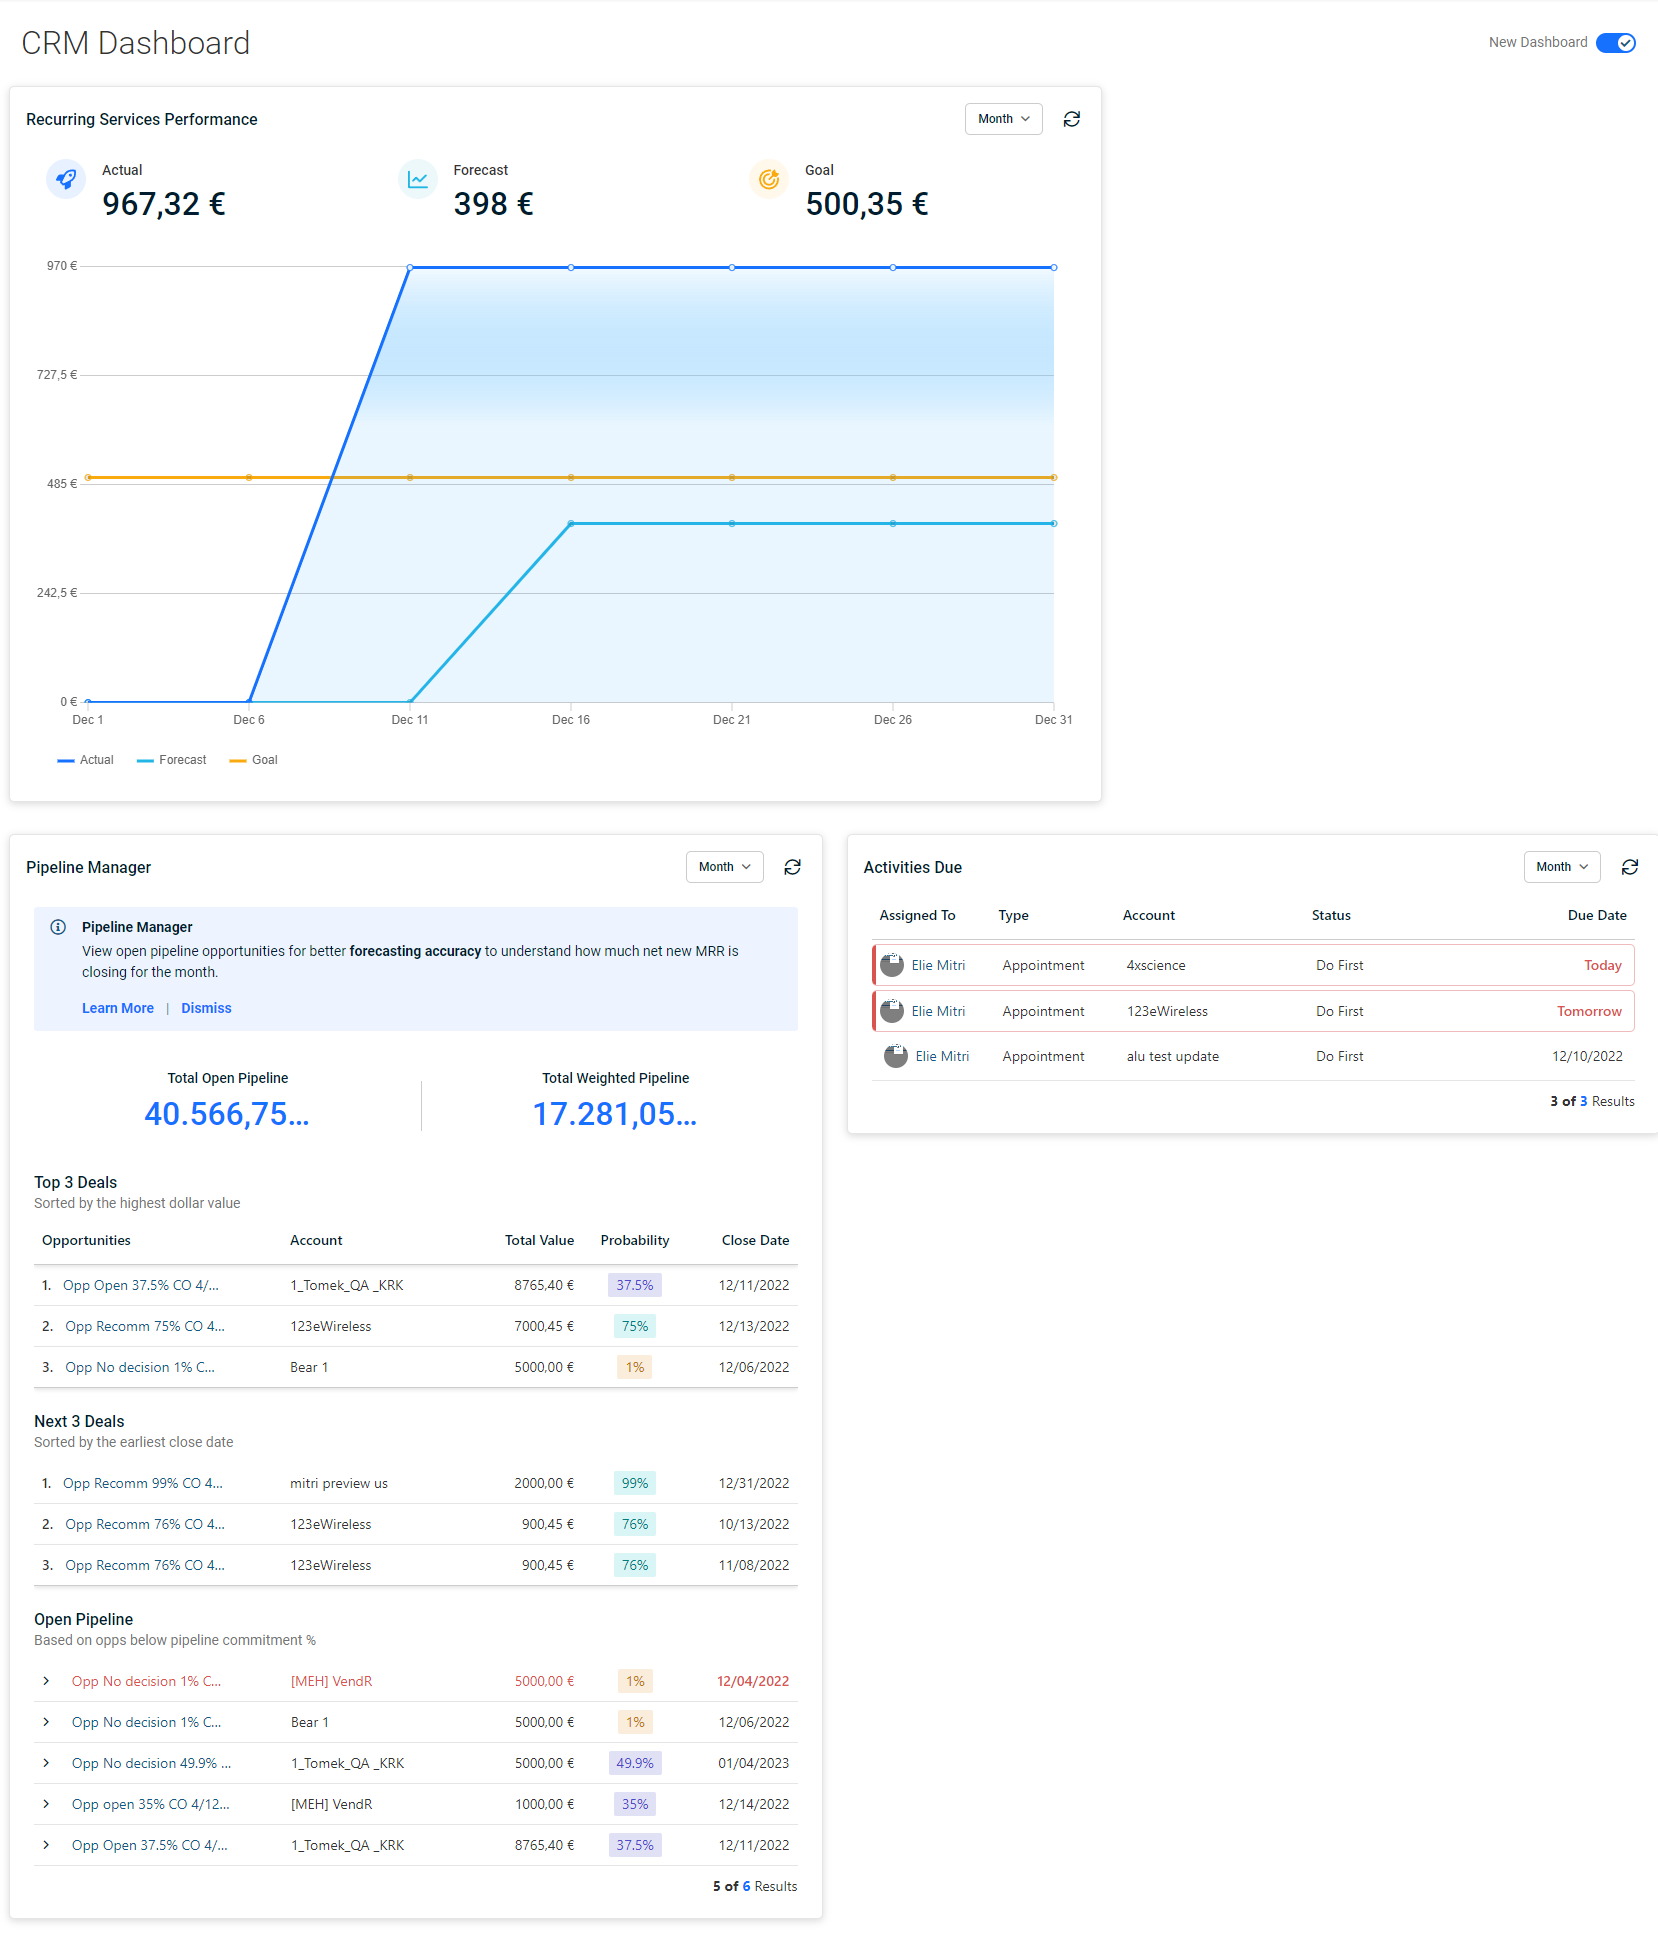
The newly revamped CRM dashboard introduces a fresh outlook and perspective to the entire set of widgets that represent various aspects of sales opportunities. The CRM dashboard serves as a one-stop visibility screen on revenue-generating analytics. MSP owners and sales managers can use the data generated to manage sales opportunities and make high-level decisions. The objective of the CRM dashboard is to clearly outline and identify sales opportunities thereby giving a wholesome picture about how much revenue they bring in per customer or how much revenue they represent at one point of time. These are presented in the form of sales and related data at a macro and sectional level. The widgets can be used either individually or as a composite set to meaningfully understand data related to sales opportunities. The data is auto-refreshed within the set time. So, you have the latest data on hand at any point of time. Each of the widget can be refreshed manually as well. You can click the refresh button provided on the top right corner of each widget. Each widget in the CRM dashboard section is explained in detail below.
Recurring Services Performance
This section plots sales performance graphs on a comparative basis. The recurring revenue tracks sales when a few requirements are satisfied:
- A quote needs to be linked to an opportunity
- The quote needs to contain a service.
- The opportunity probability needs to be equal to or surpass 50%.
Graphs are plotted together to show actual sales, forecast sales, and goal sales comparatively. Figures accompany legends for actual, forecast and goal sales. Depending on the actual, forecast, and goal figures, graphs are plotted for all the three together for month, quarter or year to date. There is a refresh button on the top right corner which you can use to manually refresh the statistics.
Pipeline Manager
Just as the name suggests, the Pipeline Manager widget shows the sales deals that are in the pipeline that might materialize into revenue opportunities at a later date. The Pipeline Manager widget represents data that is related to amounts of all open opportunities. Quite literally, the Pipeline Manager is a window of opportunities. The opportunities present in the Pipeline Manager also portray better forecasting accuracy to know how much net new MRR has been closed for the month. There is a refresh button on the top right corner which you can use to manually refresh the statistics.
Total Open Pipeline and Total Weighted Pipeline
Within the main section of the Pipeline Manager, you will see two figures - total open pipeline and total weighted pipeline. Both the figures are displayed by default in dollars. The amount displayed by total open pipeline is the sum of all open opportunities. The amount displayed by total weighted pipeline is the sum of all open opportunities x probability percentage.
Top 3 Deals
The Top 3 Deals section lists three top most open opportunities by highest dollar value. The three deals are listed in decreasing order by their dollar value. The details list out details such as name of account, total value of the deal, probability percentage and close date. You can dig deeper into further details by clicking the hyperlink of the respective opportunity name.
Next 3 Deals
The Next 3 Deals section lists the next three deals that are in the pipeline right after the top three deals. They are listed by earliest close date in ascending order. The details list out details such as name of account, total value of the deal, probability percentage and close date. You can dig deeper into further details by clicking the hyperlink of the respective opportunity name.
Open Pipeline
The Open Pipeline section lists out opportunities and their details according to the commitment percentage. The section lists up to five opportunities at the same time. You can expand or collapse each opportunity to see further details. The height of each individual opportunity section is auto-adjusted according to the extent of the details shown. You can open even multiple opportunities at the same time. The opportunities that are highlighted in red are the ones that have past due dates. The opportunities that are highlighted in blue are the ones that have due dates that are yet to pass. Each opportunity shows details such as status, the day it was created, last activity notes, name of the account, value of the deal, commitment percentage and due date. You can dig deeper into further details by clicking the hyperlink of the respective opportunity name. You can click the left and right arrow at the bottom right of the Pipeline Manager section to navigate to other pages, either next or previous. Each commitment percentage denotes a status, and they are as follows: 10 - qualification, 25 - discovery, 50 - demo, 75 - proposal, 95 - verbal/committed, and 100 - close-won. Zero percentage represents a lost deal.
Activities Due
The Activities Due widget shows a summary of different sales-related activities that are happening currently and also in the pipeline. The activities are listed according to the due dates. The activities begin today and is spread over near future days. The widget shows details such as the salesperson's name, the type of activity, the account name, the status, and the due date. The widget can be organized according to Today, Week or Month. You can click the left and right arrow at the bottom right of the Pipeline Manager section to navigate to other pages, either next or previous. There is a refresh button on the top right corner which you can use to manually refresh the statistics.
Sales Leaderboard
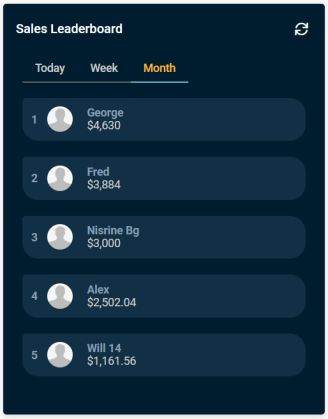
The Sales Leaderboard shows a summary of sales achieved by top salespeople. The statistics are organized according to three tabs - Today, Week (current week), and Month (current month). Today denotes all sales closed for the day. Week denotes all sales closed from current week Monday to Sunday. Month denotes from the first day of the current month to the current day. The names of top salespeople appear here in descending order according to the figures of sales they have achieved. The largest sales deal is listed first and so on and so forth. Their ranking is mentioned next to their icon picture on the left side. You can dig deeper into further details by clicking the hyperlink of the respective salesperson's name. The Sales Leaderboard has a refresh button on the top right corner which you can use to manually refresh the statistics.
Quote Amounts Due
The Quote Amounts Due widget gives you insight into the total amount due from the quotes sent on a weekly basis. While the Pending Quotes and Quote Amounts Sent show details for the past week, the Quote Amounts Due widget shows the total amount due from quotes for next week. The quotes amount due shows the summary of the total amount of quotations that are due in the next seven days from the current date. They have New, Ready to Send or Sent (without being accepted or rejected) status. The number is updated every week. You can dig deeper for further details by clicking the widget.
Quote Amounts Sent
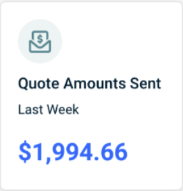
The Quote Amounts Sent widget gives you insight into the total amount of quotes sent on a weekly basis. By default, it shows the total quote amounts sent last week. Last week here refers to seven days prior to current day. The quotations that are sent are the ones that are sent to customers without being accepted or rejected. The number is updated every week. You can dig deeper for further details by clicking the widget.
Pending Quotes
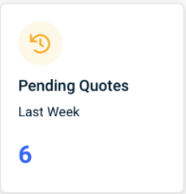
The Pending Quotes widget gives you insight into the number of pending quotes on a weekly basis. The pending quotes are generated and saved but not sent to customer. They either have New (tickets created within the last seven days from the current date), Expired (within the last seven days from the current date), Ready to Send (modified within the last seven days from the current date) or Sent (without the quote being accepted or rejected within the last seven days from the current date) status. By default, it shows the number of pending quotes last week. This widget tracks all pending quotations for the last seven days from the current date. The number is updated every week. You can dig deeper for further details by clicking the widget.


